This is one of the two heaviest units. You use f′ and f″ to find where a function rises, falls and bends, to locate and justify its extreme values, and to solve optimization problems. The Mean Value and Extreme Value Theorems tell you when such points must exist.
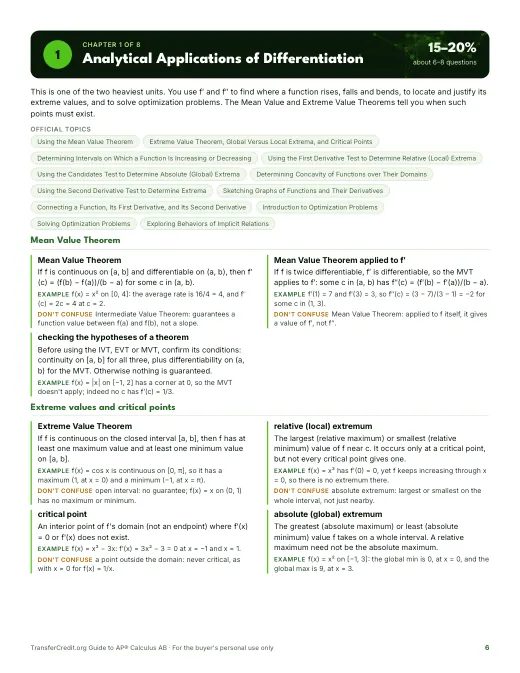
- Mean Value Theorem
- If f is continuous on [a, b] and differentiable on (a, b), then f′(c) = (f(b) − f(a))/(b − a) for some c in (a, b).
- Example: f(x) = x² on [0, 4]: the average rate is 16/4 = 4, and f′(c) = 2c = 4 at c = 2.
- Extreme Value Theorem
- If f is continuous on the closed interval [a, b], then f has at least one maximum value and at least one minimum value on [a, b].
- Example: f(x) = cos x is continuous on [0, π], so it has a maximum (1, at x = 0) and a minimum (−1, at x = π).
- increasing and decreasing test
- On an interval, if f′(x) > 0 then f is increasing; if f′(x) < 0 then f is decreasing.
- Example: f(x) = x² − 6x: f′(x) = 2x − 6 < 0 for x < 3, so f decreases on (−∞, 3).
- Candidates Test
- For absolute extrema of a continuous f on [a, b], evaluate f at the critical points and both endpoints. The largest value is the maximum; the smallest is the minimum.
- Example: f(x) = x³ − 3x on [0, 2]: f(0) = 0, f(1) = −2, f(2) = 2, so the maximum is 2 and the minimum −2.
- concave up and concave down
- The graph of f is concave up on an open interval where f′ is increasing (bending like a cup) and concave down where f′ is decreasing.
- Example: f(x) = x³: f′(x) = 3x² decreases for x < 0 and increases for x > 0, so f is concave down, then up.
- reading the graph of f′
- Where the graph of f′ is above the x-axis, f is increasing; below, f is decreasing. Where f′ crosses the x-axis, f has a relative extremum.
- Example: If the graph of f′ crosses the x-axis from above to below at x = 4, f has a relative maximum at x = 4.
- optimization
- Using the derivative to find the maximum or minimum value of a quantity, such as an area, a cost or a distance, on an interval.
- Example: A rectangle with perimeter 20 has area A = x(10 − x); A′ = 10 − 2x = 0 at x = 5, so the largest area is 25.
- critical points of an implicit relation
- Points on the curve where dy/dx is 0 or undefined. Find them from the formula for dy/dx, keeping only points that lie on the curve.
- Example: x² − y² = 9: dy/dx = x/y. No point on the curve has x = 0, so the only critical points are (±3, 0).
- checking the hypotheses of a theorem
- Before using the IVT, EVT or MVT, confirm its conditions: continuity on [a, b] for all three, plus differentiability on (a, b) for the MVT. Otherwise nothing is guaranteed.
- Example: f(x) = |x| on [−1, 2] has a corner at 0, so the MVT doesn't apply; indeed no c has f′(c) = 1/3.
- critical point
- An interior point of f's domain (not an endpoint) where f′(x) = 0 or f′(x) does not exist.
- Example: f(x) = x³ − 3x: f′(x) = 3x² − 3 = 0 at x = −1 and x = 1.
- sign chart for f′
- A number line showing where f′ is positive or negative. Mark the critical points, then test one x-value in each interval between them.
- Example: f′(x) = (x − 1)(x − 4): f′(0) > 0, f′(2) < 0, f′(5) > 0, so f rises, falls, then rises.
- endpoints as candidates
- On a closed interval, an absolute extremum can sit at an endpoint even though f′ is not 0 there. Always evaluate f at both endpoints.
- Example: f(x) = 2x + 1 on [0, 5] has no critical points; its maximum is f(5) = 11, at an endpoint.