← All AP® study guides
AP® Study Guide Printable PDF · 40 pages

TransferCredit.org Guide to AP® Statistics

AP® Statistics study guide: a printable PDF built from the College Board's official course and exam description, heaviest topics first.

  • 195 key terms, each with an example
  • 38 practice questions with every answer explained
  • A 2-page cram sheet for the night before
  • 2-, 4- and 8-week study plans built from the exam weights
Not sure yet? Try 10 free questions

Last updated 2026 · exam details checked against the College Board's published exam information in 2026

Look inside the guide

Real pages from the 40-page PDF.

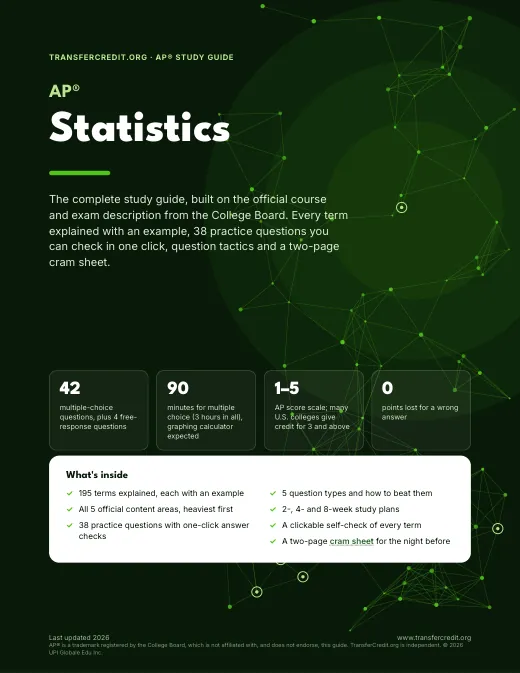
Page 1 of the TransferCredit.org Guide to AP® Statistics: the cover
Page 1 The cover
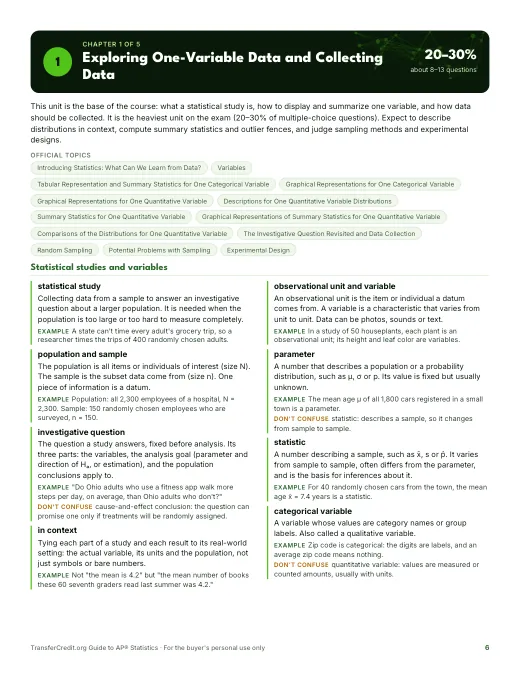
Page 6 of the TransferCredit.org Guide to AP® Statistics: the Chapter 1 opener
Page 6 The Chapter 1 opener
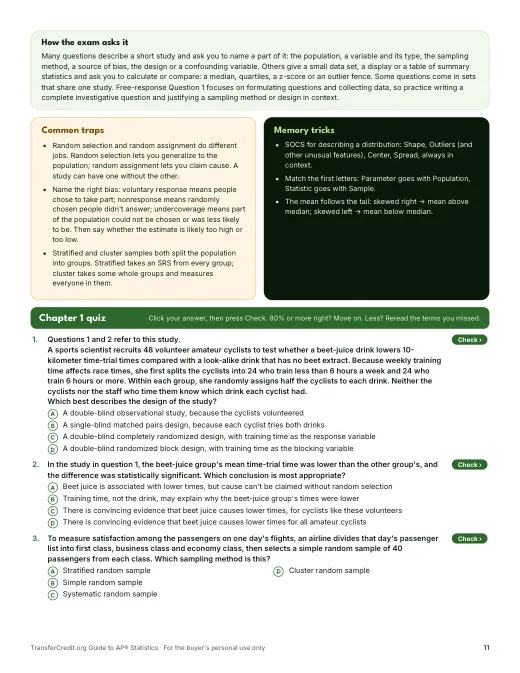
Page 11 of the TransferCredit.org Guide to AP® Statistics: a chapter quiz
Page 11 A chapter quiz
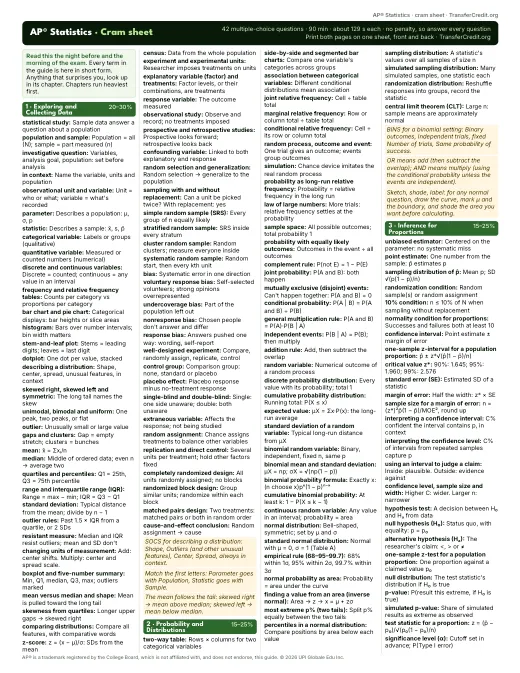
Page 39 of the TransferCredit.org Guide to AP® Statistics: the 2-page cram sheet
Page 39 The 2-page cram sheet

What you get for $5

One chapter for each area of the official course and exam description, heaviest topics first.

  • 📘40pages, printable
  • 🧭5chapters
  • 🔑195terms with examples
  • ✍️38practice questions, answers explained
  • ⚠️15exam traps to avoid
  • 📄2page cram sheet

Try 10 free AP® Statistics questions

Multiple-choice questions taken from the guide's chapter quizzes: 5 areas, heaviest first. About 20 minutes, with every answer explained and a score by area. The exam's free-response questions aren't in this quiz: see how the exam works.

10 questions  
  1. Question 1 · Exploring and Collecting Data
    Questions 1 and 2 refer to this study.
    A sports scientist recruits 48 volunteer amateur cyclists to test whether a beet-juice drink lowers 10-kilometer time-trial times compared with a look-alike drink that has no beet extract. Because weekly training time affects race times, she first splits the cyclists into 24 who train less than 6 hours a week and 24 who train 6 hours or more. Within each group, she randomly assigns half the cyclists to each drink. Neither the cyclists nor the staff who time them know which drink each cyclist had.
    Which best describes the design of the study?
    Show the answer

    Answer: B. A double-blind randomized block design, with training time as the blocking variable. The cyclists were grouped by training time first (blocks), and the drinks were randomly assigned within each group: a randomized block design. Neither the cyclists nor the timing staff knew who had which drink, so it is double-blind.

    The trap: The completely randomized choice is tempting because the drinks were randomly assigned, but the assignment was done separately within each training group. Training time is the blocking variable; the response is the time-trial time.

  2. Question 2 · Probability and Distributions
    A company recorded how each of its 240 employees usually gets to work.
    Status | Bus | Car | Bike | Total
    Full-time | 48 | 90 | 22 | 160
    Part-time | 32 | 30 | 18 | 80
    Total | 80 | 120 | 40 | 240
    What proportion of the part-time employees bike to work? (Round to three decimal places.)
    Show the answer

    Answer: D. 0.225. "Of the part-time employees" restricts attention to the Part-time row, so divide that row's bike count by the row total: 18/80 = 0.225. This is a conditional relative frequency.

    The trap: 0.450 is 18/40, which divides by the Bike column total. It answers the reverse question: what proportion of the employees who bike are part-time.

  3. Question 3 · Inference for Proportions
    A health system takes a separate random sample of 150 recent patients from each of its three hospitals and asks each patient to rate their stay as satisfied, neutral or dissatisfied. It wants to know whether the distribution of ratings differs among the three hospitals. Which procedure is appropriate?
    Show the answer

    Answer: A. Chi-square test for homogeneity. There are three separate random samples (one per hospital) and one categorical variable, the rating, with three categories. Comparing one categorical variable's distribution across several populations calls for a chi-square test for homogeneity.

    The trap: A chi-square test for independence uses one random sample classified on two variables. Here each hospital was sampled separately, so the question is whether three populations share the same distribution.

  4. Question 4 · Inference for Means
    A machine fills bags of trail mix. The bag weights are approximately normal with mean 340 grams and standard deviation 12 grams. An inspector weighs a random sample of 16 bags. What is the probability that the sample mean weight is less than 334 grams? Round to four decimal places.
    Show the answer

    Answer: C. 0.0228. x̄ is normal because the weights are normal, with mean 340 grams and standard deviation 12/√16 = 3 grams. z = (334 − 340)/3 = −2.00, and the area below it is 0.0228.

    The trap: 0.3085 uses 12, the standard deviation of single bags, instead of 12/√16 = 3, the standard deviation of sample means. Means of 16 bags vary much less than single bags do.

  5. Question 5 · Regression Analysis
    For 50 used cars of one model listed for sale online, the correlation between mileage and asking price is r = −0.81. Which statement best interprets r?
    Show the answer

    Answer: D. A strong negative linear association: cars with more miles tend to have lower asking prices. r = −0.81 is fairly close to −1, so the linear association is strong, and the negative sign means price tends to drop as mileage rises.

    The trap: The 81% choice treats r as r². The share of variation explained is r² = (−0.81)² ≈ 0.66, about 66%.

  6. Question 6 · Exploring and Collecting Data
    In the study in question 1, the beet-juice group's mean time-trial time was lower than the other group's, and the difference was statistically significant. Which conclusion is most appropriate?
    Show the answer

    Answer: C. There is convincing evidence that beet juice causes lower times, for cyclists like these volunteers. Random assignment of the drinks allows a cause-and-effect conclusion, and a significant difference is convincing evidence. The cyclists were volunteers, not a random sample, so the result applies only to cyclists like them.

    The trap: The "all amateur cyclists" choice ignores how the cyclists were chosen. Generalizing to a whole population needs random selection, and these cyclists volunteered.

  7. Question 7 · Probability and Distributions
    At a large high school, 40% of students play on a sports team (event S), 25% are in the band (event M), and 8% do both. Are events S and M independent?
    Show the answer

    Answer: A. No, because P(M | S) = 0.20, which is not equal to P(M) = 0.25. Independence means knowing S doesn't change the probability of M. P(M | S) = P(S and M)/P(S) = 0.08/0.40 = 0.20, but P(M) = 0.25. Equivalently, P(S)·P(M) = 0.10, not 0.08.

    The trap: "No, because P(S and M) = 0.08 is not 0" gets the right verdict for the wrong reason. A nonzero overlap only shows the events aren't mutually exclusive; independent events overlap too.

  8. Question 8 · Inference for Proportions
    Last year, 18% of a city's adults used its bike-share program at least once a month. After adding 40 stations, the city surveys a random sample of adults to see whether that proportion has increased. Let p be the proportion of all the city's adults who now use bike-share at least monthly. Which hypotheses fit the city's question?
    Show the answer

    Answer: B. H₀: p = 0.18 and Hₐ: p > 0.18. Hypotheses are about the parameter p. H₀ is the status quo with equality, p = 0.18, and the city's question about an increase gives the one-sided alternative p > 0.18.

    The trap: "H₀: p̂ = 0.18 and Hₐ: p̂ > 0.18" is about the sample proportion, which is known once the data are in. Hypotheses always describe the unknown population parameter.

  9. Question 9 · Inference for Means
    A delivery company wants to compare two tire tread compounds. On each of 20 vans it puts a tire of each compound on the two rear wheels, with a coin flip deciding which side gets which. After 10,000 miles it measures the tread wear of every tire. Which procedure should it use to estimate the difference in mean wear?
    Show the answer

    Answer: B. A one-sample t-interval for the population mean difference, μd. Each van carries both compounds, so the measurements come in pairs. Subtracting within each van gives one sample of 20 differences, analyzed with a one-sample t-interval for μd.

    The trap: The two-sample t-interval treats the two sets of tires as independent groups. They aren't: tires on the same van share its driver, routes and loads, so the analysis must use the within-van differences.

  10. Question 10 · Regression Analysis
    At a tutoring center, the least-squares line for predicting a student's test score from hours of tutoring is ŷ = 54.2 + 3.6x; the data include 0 to 15 hours of tutoring. What is the predicted score for a student with 8 hours of tutoring?
    Show the answer

    Answer: D. 83.0. Substitute x = 8: ŷ = 54.2 + 3.6(8) = 54.2 + 28.8 = 83.0. Eight hours is inside the 0 to 15 hours in the data, so this is interpolation.

    The trap: 28.8 is only the slope times x. The prediction must start from the intercept, 54.2.

The AP® Statistics exam at a glance

The AP® Statistics exam is from the College Board. It has 42 multiple-choice questions, plus 4 free-response questions. You get 90 minutes for multiple choice (3 hours in all), graphing calculator expected. The score scale is 1–5 (AP® score scale; many U.S. colleges give credit for 3 and above). The guide has 5 chapters, one for each area of the official course and exam description; the heaviest is Exploring One-Variable Data and Collecting Data at 20–30%.

Questions
42multiple-choice questions, plus 4 free-response questions
Time
90 minfor the 42 multiple-choice questions, about 129 seconds a question
Score
1–5AP® score scale; many U.S. colleges give credit for 3 and above
Fee
$99per exam in the U.S. and Canada in 2026-27; your school may charge more
Calculator
Yesgraphing calculator expected
Wrong answers
No penaltya wrong answer costs nothing
  • Section I has 42 multiple-choice questions in 90 minutes (50% of your score). Section II has 4 free-response questions in 90 minutes (50%); each is worth 10 points and they count equally.
  • The free-response questions come in this order: Question 1 focuses on formulating questions and collecting data, Question 2 on analyzing data and interpreting results, Question 3 is an inference question (a hypothesis test or a confidence interval), and Question 4 is a multi-part question that mixes several units.
  • The exam is fully digital: you answer every question in the Bluebook testing app. A graphing calculator with statistical capabilities is expected on both sections. Bluebook has a built-in Desmos graphing calculator; for 2027, nongraphing calculators are not allowed.
  • A formula sheet and tables (standard normal, t and chi-square) are provided for both sections.
  • Your multiple-choice score is the number of questions you answer correctly, so a wrong answer costs nothing.
  • The College Board revised AP® Statistics for the 2026–27 school year, so check that any practice material follows the current course and exam description (five units, 42 multiple-choice and 4 free-response questions).

Source: official AP® Statistics page and the official course and exam description. Last updated 2026.

What the exam covers

5 chapters, heaviest first, with each area's official weight. The guide's chapters follow this order.

  1. Exploring One-Variable Data and Collecting Data20–30% · ~8–13 Q
  2. Probability, Random Variables, and Probability Distributions15–25% · ~6–11 Q
  3. Inference for Categorical Data: Proportions15–25% · ~6–11 Q
  4. Inference for Quantitative Data: Means10–20% · ~4–8 Q
  5. Regression Analysis10–20% · ~4–8 Q

Where to start: the 3 heaviest areas (marked in the map) carry about 27 of the 42 questions. The guide puts them first, so working front to back covers the most points earliest.

AP® Statistics study guide by area

The heaviest area is open to read now. The full guide has a chapter for every area, each with all its terms, a quiz and an answer key.

1 of 5 chapters open  ·  in the guide's order
20–30% · about 8–13 questions · free preview Exploring One-Variable Data and Collecting Data Chapter 1 of the guide

This unit is the base of the course: what a statistical study is, how to display and summarize one variable, and how data should be collected. It is the heaviest unit on the exam (20–30% of multiple-choice questions). Expect to describe distributions in context, compute summary statistics and outlier fences, and judge sampling methods and experimental designs.

Key terms, with examples

statistical study
Collecting data from a sample to answer an investigative question about a larger population. It is needed when the population is too large or too hard to measure completely.
Example: A state can't time every adult's grocery trip, so a researcher times the trips of 400 randomly chosen adults.
frequency and relative frequency tables
A frequency table gives the count in each category of a categorical variable. A relative frequency table gives each category's proportion; percentages and ratios carry the same information.
Example: Of 80 diners, 36 ordered pasta: frequency 36, relative frequency 36/80 = 0.45, or 45%.
histogram
Groups a quantitative variable's values into ordered intervals (bins). Each bar's height is the count or proportion in its bin; changing the bin width can change the picture.
Example: Ages of 60 museum visitors in 10-year bins look unimodal; 5-year bins reveal a second peak of young children.
mean
The sum of the values divided by the number of values: x̄ = Σxᵢ/n for a sample. With the median, one of the two common measures of center.
Example: Quiz scores 6, 8, 8, 9, 10: x̄ = 41/5 = 8.2.
comparing distributions
Comparing two or more distributions of the same variable means comparing shape, center, variability and unusual features, using comparative words (greater than, less than) and context.
Example: Tomato plants given more light have a higher median height (24 cm vs 19 cm) and a larger IQR (8 cm vs 5 cm).
census
Recording information from every item or individual in the population, not just a sample.
Example: A club with 45 members asks all 45 which night they prefer for meetings.
sampling with and without replacement
Without replacement, a selected unit is set aside and can't be chosen again. With replacement, it returns to the population and could be chosen again.
Example: Drawing 3 raffle names and keeping them out is without replacement; putting each name back first is with replacement.
well-designed experiment
An experiment with comparison of at least two treatment groups (one may be a control), random assignment of treatments, replication, and direct control of extraneous sources of variation.
Example: Twenty bean plants randomly assigned to two lamp types, 10 per lamp, all in identical pots, soil and water.
population and sample
The population is all items or individuals of interest (size N). The sample is the subset data come from (size n). One piece of information is a datum.
Example: Population: all 2,300 employees of a hospital, N = 2,300. Sample: 150 randomly chosen employees who are surveyed, n = 150.
bar chart and pie chart
Displays for one categorical variable. Bar heights show each category's count or proportion; pie slice areas show each category's share of the whole (100%).
Example: Favorite seasons of 120 students: bars of heights 42, 30, 24 and 24, or pie slices of 35%, 25%, 20% and 20%.
stem-and-leaf plot
A display that splits each value into a stem (leading digit or digits) and a leaf (usually the last digit), both in order, so every data value stays visible.
Example: Scores 62, 67, 71, 75, 75 → stem 6 | leaves 2 7; stem 7 | leaves 1 5 5.
median
The middle value of the data ordered from smallest (minimum) to largest (maximum). With an odd n take the middle value; with an even n average the two middle values.
Example: Four puppies weigh 3, 5, 8 and 12 pounds: the median weight is (5 + 8)/2 = 6.5 pounds.

What this area covers

Statistical studies and variablesTables and graphs for one categorical variableGraphing and describing quantitative dataSummary statistics and boxplotsComparing distributions and z-scoresWays to collect dataSampling methods and biasExperimental design

How the exam asks it

Many questions describe a short study and ask you to name a part of it: the population, a variable and its type, the sampling method, a source of bias, the design or a confounding variable. Others give a small data set, a display or a table of summary statistics and ask you to calculate or compare: a median, quartiles, a z-score or an outlier fence. Some questions come in sets that share one study. Free-response Question 1 focuses on formulating questions and collecting data, so practice writing a complete investigative question and justifying a sampling method or design in context.

Common traps

Trap 1. Random selection and random assignment do different jobs. Random selection lets you generalize to the population; random assignment lets you claim cause. A study can have one without the other.

Trap 2. Name the right bias: voluntary response means people chose to take part; nonresponse means randomly chosen people didn't answer; undercoverage means part of the population could not be chosen or was less likely to be. Then say whether the estimate is likely too high or too low.

Trap 3. Stratified and cluster samples both split the population into groups. Stratified takes an SRS from every group; cluster takes some whole groups and measures everyone in them.

Memory trick

SOCS for describing a distribution: Shape, Outliers (and other unusual features), Center, Spread, always in context.

Match the first letters: Parameter goes with Population, Statistic goes with Sample.

How AP® Statistics questions are written

The exam has 42 multiple-choice questions, plus 4 free-response questions. The guide sorts the questions into 5 types; spot the type and you'll know what the question wants before you read the choices.

Type 1

Identify the sampling method, bias or design

A short description of how a sample was chosen or how an experiment was run, then "Which sampling method...?", "Which type of bias...?" or "Which best describes the design?"

  • Underline who could be chosen, how they were chosen (by chance or not), and who was left out or never answered.
  • Match those facts to one definition: SRS, stratified, cluster or systematic; voluntary response, undercoverage, nonresponse or response bias; completely randomized, block or matched pairs.
  • Find the one detail that separates look-alikes, such as some groups versus every group, or volunteers versus chosen people who didn't reply.
Type 2

Choose and set up an inference procedure

A study's goal and data, then "Which inference procedure is appropriate?" or "Which hypotheses...?" The choices name procedures (z or t, one or two samples, paired, chi-square) or write hypotheses in symbols.

  • Classify the response: categorical (a proportion, or counts in a two-way table) or quantitative (a mean).
  • Count the samples: one, two independent, or paired values from the same or matched units.
  • To estimate a value, use an interval; to judge a claim, use a test. Hypotheses use parameters (p, μ, μd), never p̂ or x̄.
Type 3

Calculate a probability or statistic

Numbers in the stem (a mean and standard deviation, a small data set, sample results or a regression equation) and four numerical choices, with the rounding stated.

  • Write the formula or calculator command first (normal or t area, x̄ ± t*·SE, ŷ = a + bx), and sketch any normal curve with the area shaded.
  • Compute with the calculator, then check the result against your sketch: a small shaded tail must give a small probability.
  • Expect wrong choices built from common slips: the wrong tail, σ instead of σ/√n, z* instead of t*.
Type 4

Interpret a result in context

A finished result (a confidence interval, p-value, slope, r or r²) and four sentences about it; only one uses the right parameter, direction and context.

  • Name what the number describes: a population mean or proportion, a difference, a predicted change, or a share of variation.
  • Fill in the standard sentence: "We are C% confident that…", "Assuming H₀ is true, the probability of…", "For each additional…, the predicted…".
  • Cross out choices about individuals when the result is about a parameter, and any that say the data prove or accept H₀.
Type 5

Read a table or display

A two-way table, a table of summary statistics, or a described graph (histogram, boxplot, scatterplot), then a question about a proportion, a comparison or a feature.

  • Read the labels, units and totals before any numbers.
  • For "of the…" or "given…" questions, the group named is the denominator: use that row or column total.
  • Compare like with like: proportions, not counts, when the groups have different sizes.

Test-day habits that add points

  1. Answer every question. There's no penalty for a wrong answer. A blank is always worth zero, so never leave one.
  2. Predict, then look. Name the answer before reading the choices. It protects you from distractors written to sound right.
  3. Eliminate. Cross out choices you know are wrong. Every choice you rule out raises your odds on a guess.
  4. Mark and move on. If a question takes more than a minute, pick your best guess, mark it and come back if time allows.
  5. Watch absolute words. Choices with "always", "never" or "only" are often wrong, because most rules and findings have exceptions. Treat this as a tiebreaker, not a rule.
  6. Change answers for a reason. Switch an answer only when you can say why the new one is better, such as a detail you missed.
  7. The four free-response questions. Section II has 4 free-response questions in 90 minutes, worth 50% of your score. They are four 10-point question types, weighted equally (12.5% each), in this order. Question 1: Multi-Focus on Practices 1 and 2 (formulating questions and collecting data), in several parts. Question 2: Multi-Focus on Practices 3 and 4 (analyzing data and interpreting results), in several parts. Question 3: Inference (Hypothesis Test or Confidence Interval). Question 4: Multi-Focus on Practices 2, 3, and 4, in several parts that draw on several content areas. A graphing calculator with statistical capabilities is expected.

Pacing: 42 questions in 90 minutes, about 129 seconds a question.

AP® Statistics flashcards

Try the first 8 cards free. Read the term, say the definition out loud, then select the card to check yourself. Arrow keys move between cards.

Free card 1 of 8 (deck total: 195)

How to study for AP® Statistics: a 5-step plan

Follow the steps, then enter your test date. The planner gives you a dated plan that starts with the heaviest areas and saves the last days for review.

  1. Take the 10 free questionsSee which AP® Statistics areas you already know.
  2. Study the heaviest areas firstStart with Exploring One-Variable Data and Collecting Data, Probability, Random Variables, and Probability Distributions and Inference for Categorical Data: Proportions, then work down the exam map.
  3. Learn each term with an exampleSay the definition out loud, then check it with the flashcards. A term you can't use in an example isn't learned yet.
  4. Quiz yourself and study the trapsAfter each area, answer its quiz and read why the tempting wrong answer is wrong.
  5. Plan backwards from your exam dateBuild a dated plan, keep the last days for a full review, and read the cram sheet the night before.

How it works

  1. 1Check outSelect Get the guide · $5 and pay on TransferCredit.org's secure checkout.
  2. 2Download the PDFFrom your TransferCredit.org account.
  3. 3Study the heaviest areas firstFollow the 2-, 4- or 8-week plan, then read the cram sheet the night before.

This page or the full guide

Everything on this page is free with no account. The full guide is a PDF you keep.

What's on this page and in the full study guide
Study toolThis pageFull study guide ($5)
ChaptersA preview of 1 of 5All 5
Terms explainedA sample from the open chaptersAll 195, each with an example
Practice questions10 free questions38, with an answer key
Flashcards8 cardsAll 195 terms on the self-check list
Study planDated planner2-, 4- and 8-week plans
Cram sheet—2 pages, for the night before
FormatWeb page40-page PDF, printable

Questions students ask

What's in the full AP® Statistics study guide?
40 pages: 5 chapters, one for each area of the College Board's official course and exam description, heaviest topics first. 195 terms, each with a plain-English definition and an example, common traps and memory tricks, 38 practice questions with an answer key that explains every answer, question tactics, 2-, 4- and 8-week study plans and a 2-page cram sheet.
How much is the full AP® Statistics study guide?
The full 40-page PDF is $5. The 10 practice questions on this page are free.
How do I get the full guide?
Select Get the guide · $5 and check out on TransferCredit.org. Then sign in to your TransferCredit.org account to download the PDF.
Can I print the guide or use it on my phone?
Yes. It's a PDF, so it opens on phones, tablets and computers, and printing is allowed. Its tick boxes and answer bubbles work in PDF readers that support forms. Copying and editing are turned off.
Can I try the AP® Statistics guide before I buy it?
Yes. This page has 10 questions from the guide's own chapter quizzes, a preview of the heaviest area, 8 flashcards and a study planner. No account needed.
Is this an official AP® study guide?
No. AP® is a trademark registered by the College Board, which is not affiliated with, and does not endorse, this guide. TransferCredit.org is independent. We built the guide from the College Board's official course and exam description, and the exam details were checked against the College Board's published exam information in 2026.
How was this study guide made?
One chapter for each area of the official course and exam description, using its published weights. Each chapter was written, then fact-checked against the official exam information in a separate review. The practice questions are original: none are copied from the College Board's released questions.
How up to date is this AP® Statistics guide?
Last updated 2026. The exam details were checked against the College Board's published exam information in 2026. Exams change, so confirm the details on the official AP® Statistics page before you test.
More questions about the AP® Statistics exam (16)
What is the AP® Statistics exam?
The AP® Statistics exam is from the College Board. It has 42 multiple-choice questions, plus 4 free-response questions. You get 90 minutes for multiple choice (3 hours in all), graphing calculator expected. The score scale is 1–5 (AP® score scale; many U.S. colleges give credit for 3 and above). The guide has 5 chapters, one for each area of the official course and exam description; the heaviest is Exploring One-Variable Data and Collecting Data at 20–30%.
How many questions are on the AP® Statistics exam, and how long is it?
Section I has 42 multiple-choice questions in 90 minutes (50% of your score). Section II has 4 free-response questions in 90 minutes (50%); each is worth 10 points and they count equally.
How is the AP® Statistics exam scored?
The score scale is 1–5: AP® score scale; many U.S. colleges give credit for 3 and above. Your multiple-choice score is the number of questions you answer correctly, so a wrong answer costs nothing.
What AP® Statistics score do I need for college credit?
Many U.S. colleges give credit for 3 and above. Each college sets its own credit policy, so check the one at your college before you count on the credit.
How much does the AP® Statistics exam cost?
The fee is $99: per exam in the U.S. and Canada in 2026-27; your school may charge more. Fees can change, so check the official page when you register.
Can I use a calculator on the AP® Statistics exam?
A graphing calculator with statistical capabilities is expected on both sections. Bluebook has a built-in Desmos graphing calculator; for 2027, nongraphing calculators are not allowed.
Is there a penalty for guessing on AP® Statistics?
No. There's no penalty for a wrong answer. A blank is always worth zero, so never leave one.
What topics are on the AP® Statistics exam?
5 areas, from the official course and exam description: Exploring One-Variable Data and Collecting Data (20–30%); Probability, Random Variables, and Probability Distributions (15–25%); Inference for Categorical Data: Proportions (15–25%); Inference for Quantitative Data: Means (10–20%); Regression Analysis (10–20%).
Which AP® Statistics topics should I study first?
The 3 heaviest areas (marked in the map) carry about 27 of the 42 questions. The guide puts them first, so working front to back covers the most points earliest.
Is the AP® Statistics exam hard?
It depends on what you already know. The largest area, Exploring One-Variable Data and Collecting Data, is 20–30%, and the smallest, Regression Analysis, is 10–20%. Try the 10 free questions above to see where you stand in about 20 minutes.
What kinds of questions are on the AP® Statistics exam?
The exam has 42 multiple-choice questions, plus 4 free-response questions. The guide sorts the questions into 5 types: “Identify the sampling method, bias or design”, “Choose and set up an inference procedure”, “Calculate a probability or statistic”, “Interpret a result in context” and “Read a table or display”. Multiple-choice questions have 4 answer choices. See how each type is written.
What are the free-response questions on the AP® Statistics exam?
Section II has 4 free-response questions in 90 minutes, worth 50% of your score. They are four 10-point question types, weighted equally (12.5% each), in this order. Question 1: Multi-Focus on Practices 1 and 2 (formulating questions and collecting data), in several parts. Question 2: Multi-Focus on Practices 3 and 4 (analyzing data and interpreting results), in several parts. Question 3: Inference (Hypothesis Test or Confidence Interval). Question 4: Multi-Focus on Practices 2, 3, and 4, in several parts that draw on several content areas. A graphing calculator with statistical capabilities is expected.
How should I pace myself on the AP® Statistics exam?
42 questions in 90 minutes, about 129 seconds a question. If a question takes more than a minute, pick your best guess, mark it and come back if time allows.
How long should I study for AP® Statistics?
Take the 10 free questions to see where you stand. The full guide has 2-, 4- and 8-week plans built from the exam weights, and the planner on this page builds a dated plan from your exam date.
How do I know I'm ready for the AP® Statistics exam?
The guide's readiness checklist: You can explain every term on the checklist without notes. You score 80% or better on every chapter quiz. You can read the cram sheet and nothing on it surprises you. You know the AP® score your college gives credit for, and your exam date.
What should I do the night before?
Read the 2-page cram sheet once, slowly. Check your exam time and room with your AP® coordinator. The whole exam is taken in the Bluebook app, which has a built-in graphing calculator; you may also bring up to 2 approved handheld graphing calculators. In the morning, skim the traps, then stop studying.

How we built this guide

We built one chapter for each area of the College Board's official course and exam description for AP® Statistics, using its published weights to order the chapters and size the quizzes. Each chapter was written, then fact-checked against the official exam information in a separate review. The exam details were checked against the College Board's published exam information in 2026.

Sources: official AP® Statistics page, official course and exam description. Last updated 2026.

AP® is a trademark registered by the College Board, which is not affiliated with, and does not endorse, this guide. TransferCredit.org is independent and not affiliated with the College Board. © 2026 UPI Globale Edu Inc.

Ready for the full AP® Statistics guide? 40 pages, 195 terms, 38 practice questions and a 2-page cram sheet, $5.

Get the guide · $5

In the full guide

TransferCredit.org Guide to AP® Statistics

  • All 5 chapters
  • 195 terms with examples
  • 38 practice questions with an answer key
  • A 2-page cram sheet and 2-, 4- and 8-week plans
Get the guide · $5