← All AP® study guides
AP® Study Guide Printable PDF · 44 pages

TransferCredit.org Guide to AP® Macroeconomics

AP® Macroeconomics study guide: a printable PDF built from the College Board's official course and exam description, heaviest topics first.

  • 187 key terms, each with an example
  • 43 practice questions with every answer explained
  • A 2-page cram sheet for the night before
  • 2-, 4- and 8-week study plans built from the exam weights
Not sure yet? Try 10 free questions

Last updated 2026 · exam details checked against the College Board's published exam information in 2026

Look inside the guide

Real pages from the 44-page PDF.

Page 1 of the TransferCredit.org Guide to AP® Macroeconomics: the cover
Page 1 The cover
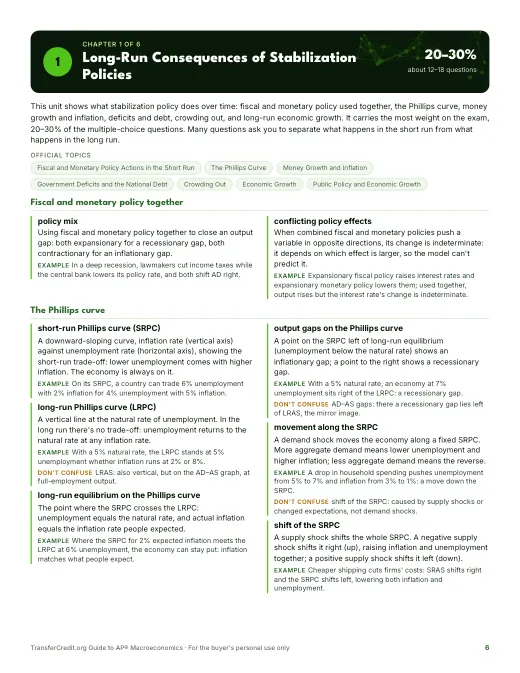
Page 6 of the TransferCredit.org Guide to AP® Macroeconomics: the Chapter 1 opener
Page 6 The Chapter 1 opener
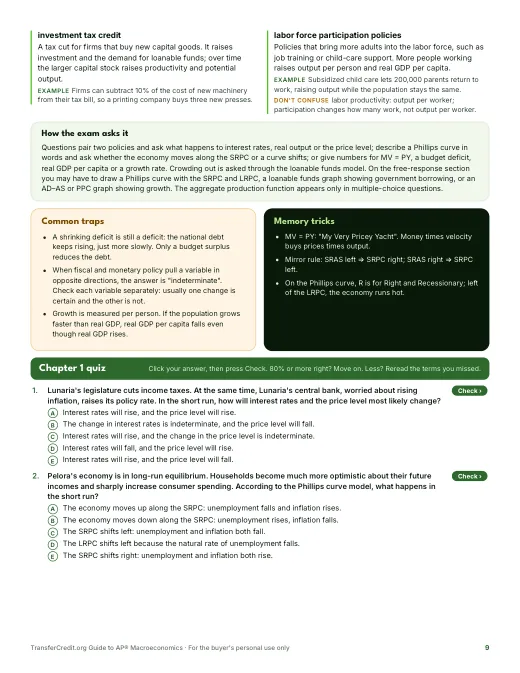
Page 9 of the TransferCredit.org Guide to AP® Macroeconomics: a chapter quiz
Page 9 A chapter quiz
Page 43 of the TransferCredit.org Guide to AP® Macroeconomics: the 2-page cram sheet
Page 43 The 2-page cram sheet

What you get for $5

One chapter for each area of the official course and exam description, heaviest topics first.

  • 📘44pages, printable
  • 🧭6chapters
  • 🔑187terms with examples
  • ✍️43practice questions, answers explained
  • ⚠️18exam traps to avoid
  • 📄2page cram sheet

Try 10 free AP® Macroeconomics questions

Multiple-choice questions taken from the guide's chapter quizzes: 6 areas, heaviest first. About 10 minutes, with every answer explained and a score by area. The exam's free-response questions aren't in this quiz: see how the exam works.

10 questions  
  1. Question 1 · Stabilization Policies
    Lunaria's legislature cuts income taxes. At the same time, Lunaria's central bank, worried about rising inflation, raises its policy rate. In the short run, how will interest rates and the price level most likely change?
    Show the answer

    Answer: A. Interest rates will rise, and the change in the price level is indeterminate.. The tax cut shifts AD right and pushes interest rates up as the government borrows more. The higher policy rate also raises interest rates but shifts AD left. Both push rates up, so they rise; AD is pulled both ways, so the price level's change depends on which effect is larger.

    The trap: "The price level will rise" counts only the tax cut. The higher policy rate cuts investment and consumption and shifts AD left, so without knowing the sizes the net effect can't be predicted.

  2. Question 2 · National Income
    Real GDP in Ardonia is $90 billion below full-employment output. Ardonia's MPC is 0.9. Assuming the full multiplier effect and no change in taxes, by how much would government purchases have to increase to close the gap?
    Show the answer

    Answer: D. $9 billion. The spending multiplier is 1 ÷ (1 − 0.9) = 10, so each $1 of new purchases can raise real GDP by up to $10. Closing a $90 billion gap takes $90 billion ÷ 10 = $9 billion.

    The trap: $10 billion uses the tax multiplier (0.9 ÷ 0.1 = 9). That is the size of the tax cut that would close the gap, not the increase in purchases.

  3. Question 3 · Financial Sector
    Assume a banking system with limited reserves and a required reserve ratio of 20 percent. Dakota deposits $2,000 in cash into her checking account at Harbor Bank. If banks lend out all excess reserves and every loan is redeposited, what is the maximum increase in the money supply that the banking system can create from this deposit?
    Show the answer

    Answer: B. $8,000. Harbor Bank must keep 20% of $2,000, or $400, so its excess reserves are $1,600. The maximum money multiplier is 1 ÷ 0.20 = 5, so lending can create up to $1,600 × 5 = $8,000 of new money. The deposit itself adds nothing: the $2,000 was already money as cash.

    The trap: $10,000 multiplies the whole deposit by 5. That is the most total checking deposits can grow, but $2,000 of it is Dakota's cash, which was already counted in the money supply.

  4. Question 4 · Economic Indicators
    In Varnia, the adult population is 80 million. Of these adults, 46 million have jobs, 4 million have no job and are actively looking for one, and the rest are not looking for work. What are Varnia's unemployment rate and labor force participation rate?
    Show the answer

    Answer: C. 8% unemployment; 62.5% participation. The labor force is the employed plus the unemployed who are looking: 46 + 4 = 50 million. Unemployment rate = 4 ÷ 50 × 100 = 8%. Participation rate = 50 ÷ 80 × 100 = 62.5%.

    The trap: 5% unemployment comes from dividing the 4 million unemployed by the whole adult population of 80 million. The unemployment rate divides by the labor force only.

  5. Question 5 · Open Economy
    In one year, Country Q's exports of goods and services total $500 billion and its imports total $560 billion. It also has net income from abroad of +$25 billion and net unilateral transfers of −$15 billion. If the balance of payments balances, what are Country Q's current account and capital and financial account balances?
    Show the answer

    Answer: E. Current account −$50 billion; capital and financial account +$50 billion. Current account = net exports + net income + net transfers = (500 − 560) + 25 − 15 = −$50 billion. Because CA + CFA = 0, the capital and financial account shows a +$50 billion surplus, a net financial capital inflow.

    The trap: "Current account −$60 billion" counts only the trade balance and leaves out net income and net transfers, which are also part of the current account.

  6. Question 6 · Basic Economic Concepts
    Using the same resources, a worker in Corvia can make either 12 shirts or 4 radios in a day, and a worker in Palvan can make either 10 shirts or 2 radios. If each country specializes according to comparative advantage, which terms of trade would benefit both countries?
    Show the answer

    Answer: C. 1 radio for 4 shirts. A radio costs Corvia 3 shirts (12 ÷ 4) and Palvan 5 shirts (10 ÷ 2), so Corvia makes radios and Palvan makes shirts. Any price between 3 and 5 shirts per radio helps both; 4 shirts per radio is the only choice in that range.

    The trap: 1 radio for 6 shirts looks generous to Corvia, but Palvan would pay more than the 5 shirts a radio costs it at home, so Palvan would refuse.

  7. Question 7 · Stabilization Policies
    Pelora's economy is in long-run equilibrium. Households become much more optimistic about their future incomes and sharply increase consumer spending. According to the Phillips curve model, what happens in the short run?
    Show the answer

    Answer: A. The economy moves up along the SRPC: unemployment falls and inflation rises.. More consumer spending is a positive demand shock: AD shifts right, so output rises, unemployment falls and the price level rises faster. On the Phillips curve, demand shocks move the economy along the existing SRPC, here up and to the left.

    The trap: "The LRPC shifts left" mistakes a temporary drop in unemployment for a change in the natural rate. The natural rate depends on frictional and structural unemployment, not on spending.

  8. Question 8 · National Income
    In Belmar, when disposable income rises from $800 billion to $900 billion, consumer spending rises from $700 billion to $775 billion. What is Belmar's expenditure multiplier?
    Show the answer

    Answer: B. 4. MPC = change in consumption ÷ change in disposable income = $75 billion ÷ $100 billion = 0.75. The expenditure multiplier is 1 ÷ (1 − 0.75) = 4.

    The trap: 8 comes from dividing total spending by total income (700 ÷ 800 = 0.875) instead of using the changes. The MPC is built from changes only.

  9. Question 9 · Financial Sector
    Ines lends money to a small business for one year at a nominal interest rate of 7 percent. When they agree on the loan, both expect 3 percent inflation, but actual inflation for the year turns out to be 5 percent. What real interest rate did Ines earn, and who gained from the unexpected inflation?
    Show the answer

    Answer: D. 2 percent; the business gained. In hindsight, the real interest rate is the nominal rate minus actual inflation: 7% − 5% = 2%. Ines expected 7% − 3% = 4%. Inflation above what both expected means the business repays with dollars worth less than planned, so the borrower gains.

    The trap: "4 percent; the business gained" subtracts expected inflation. That is the real rate Ines planned on, not the one she actually earned.

  10. Question 10 · Economic Indicators
    Marisol's salary rose from $40,000 in Year 1 to $46,000 in Year 2. Over the same period, the consumer price index rose from 100 to 115. What happened to her real salary?
    Show the answer

    Answer: E. It stayed the same.. Her real Year 2 salary is $46,000 ÷ 115 × 100 = $40,000 in Year 1 dollars. Her pay and prices both rose 15%, so her purchasing power did not change.

    The trap: "It rose by 15%" is the change in her nominal salary. It ignores the 15% rise in prices, which cancels out the raise.

The AP® Macroeconomics exam at a glance

The AP® Macroeconomics exam is from the College Board. It has 60 multiple-choice questions (5 choices each), plus 3 free-response questions. You get 70 minutes for multiple choice (2 hours 10 minutes in all), four-function calculator allowed. The score scale is 1–5 (AP® score scale; many U.S. colleges give credit for 3 and above). The guide has 6 chapters, one for each area of the official course and exam description; the heaviest is Long-Run Consequences of Stabilization Policies at 20–30%.

Questions
60multiple-choice questions (5 choices each), plus 3 free-response questions
Time
70 minfor the 60 multiple-choice questions, about 70 seconds a question
Score
1–5AP® score scale; many U.S. colleges give credit for 3 and above
Fee
$99per exam in the U.S. and Canada in 2026-27; your school may charge more
Calculator
Yesfour-function calculator allowed
Wrong answers
No penaltya wrong answer costs nothing
  • Section I has 60 multiple-choice questions in 70 minutes (66.65% of your score), each with five choices. Section II has 3 free-response questions in 60 minutes, including a 10-minute reading period (33.35%): one long question (10 points) and two short questions (5 points each).
  • On the free-response section, drawing and labeling graphs is 30–50% of the points, explaining 25–35%, making assertions 10–20% and calculating 10–25%. Show your work on every calculation.
  • This is a hybrid digital exam: you answer the multiple-choice questions in the Bluebook testing app and handwrite your free-response answers in a paper booklet. A four-function calculator is allowed on both sections (your own or the Desmos 4-function calculator in Bluebook); scientific and graphing calculators are not.
  • Your multiple-choice score is the number of questions you answer correctly, so a wrong answer costs nothing.
  • Units 3, 4 and 5 together are 55–80% of the multiple-choice section. Multiple-choice questions never ask you to draw, but many give you a graph to read, and 16–20% of them involve numbers or a calculation.

Source: official AP® Macroeconomics page and the official course and exam description. Last updated 2026.

What the exam covers

6 chapters, heaviest first, with each area's official weight. The guide's chapters follow this order.

  1. Long-Run Consequences of Stabilization Policies20–30% · ~12–18 Q
  2. National Income and Price Determination17–27% · ~10–16 Q
  3. Financial Sector18–23% · ~11–14 Q
  4. Economic Indicators and the Business Cycle12–17% · ~7–10 Q
  5. Open Economy—International Trade and Finance10–13% · ~6–8 Q
  6. Basic Economic Concepts5–10% · ~3–6 Q

Where to start: the 3 heaviest areas (marked in the map) carry about 41 of the 60 questions. The guide puts them first, so working front to back covers the most points earliest.

AP® Macroeconomics study guide by area

The heaviest area is open to read now. The full guide has a chapter for every area, each with all its terms, a quiz and an answer key.

1 of 6 chapters open  ·  in the guide's order
20–30% · about 12–18 questions · free preview Long-Run Consequences of Stabilization Policies Chapter 1 of the guide

This unit shows what stabilization policy does over time: fiscal and monetary policy used together, the Phillips curve, money growth and inflation, deficits and debt, crowding out, and long-run economic growth. It carries the most weight on the exam, 20–30% of the multiple-choice questions. Many questions ask you to separate what happens in the short run from what happens in the long run.

Key terms, with examples

policy mix
Using fiscal and monetary policy together to close an output gap: both expansionary for a recessionary gap, both contractionary for an inflationary gap.
Example: In a deep recession, lawmakers cut income taxes while the central bank lowers its policy rate, and both shift AD right.
short-run Phillips curve (SRPC)
A downward-sloping curve, inflation rate (vertical axis) against unemployment rate (horizontal axis), showing the short-run trade-off: lower unemployment comes with higher inflation. The economy is always on it.
Example: On its SRPC, a country can trade 6% unemployment with 2% inflation for 4% unemployment with 5% inflation.
quantity theory of money
The theory that, in the long run, the growth rate of the money supply determines the inflation rate. Increasing the money supply too fast for a sustained period causes inflation.
Example: A government that prints money to grow the money supply 40% a year, while output grows 2%, ends up with high inflation.
budget deficit
The amount by which government purchases plus transfer payments exceed tax revenues in a given year.
Example: Taxes $3.0 trillion, purchases $2.2 trillion and transfers $1.3 trillion leave a $0.5 trillion deficit.
government borrowing
Selling bonds to finance a budget deficit. In the loanable funds model it shifts demand right (or, as lower public saving, shifts supply left) and raises the real interest rate.
Example: To cover a $400 billion deficit, the Treasury sells $400 billion of new bonds to investors.
economic growth
A sustained rise in an economy's output, measured as the growth rate of real GDP per capita over time.
Example: If real GDP per person rises from $30,000 to $45,000 over 20 years, the country has experienced economic growth.
supply-side fiscal policy
Tax and spending policies that change incentives to work, save and invest. They affect aggregate demand, aggregate supply and potential output in both the short run and the long run.
Example: Lowering marginal income tax rates lets people keep more of each extra dollar they earn, encouraging more work and saving.
conflicting policy effects
When combined fiscal and monetary policies push a variable in opposite directions, its change is indeterminate: it depends on which effect is larger, so the model can't predict it.
Example: Expansionary fiscal policy raises interest rates and expansionary monetary policy lowers them; used together, output rises but the interest rate's change is indeterminate.
long-run Phillips curve (LRPC)
A vertical line at the natural rate of unemployment. In the long run there's no trade-off: unemployment returns to the natural rate at any inflation rate.
Example: With a 5% natural rate, the LRPC stands at 5% unemployment whether inflation runs at 2% or 8%.
equation of exchange
MV = PY: the money supply times velocity equals the price level times real output. Both sides equal nominal GDP.
Example: If M is $500 billion and V is 6, total spending (PY) is $3 trillion.
budget surplus
The amount by which tax revenues exceed government purchases plus transfer payments in a given year. A surplus can be used to pay down the national debt.
Example: Strong job growth lifts tax revenue to $900 billion while purchases and transfers total $850 billion: a $50 billion surplus.
crowding out
The adverse effect of increased government borrowing: a higher real interest rate reduces interest-sensitive private spending, such as business investment, in the short run.
Example: Government borrowing pushes the real interest rate from 3% to 5%, and a bakery chain cancels its loan for new ovens.


What this area covers

Fiscal and monetary policy togetherThe Phillips curveMoney growth and inflationDeficits and the national debtCrowding outMeasuring and explaining economic growthPublic policy and economic growth

How the exam asks it

Questions pair two policies and ask what happens to interest rates, real output or the price level; describe a Phillips curve in words and ask whether the economy moves along the SRPC or a curve shifts; or give numbers for MV = PY, a budget deficit, real GDP per capita or a growth rate. Crowding out is asked through the loanable funds model. On the free-response section you may have to draw a Phillips curve with the SRPC and LRPC, a loanable funds graph showing government borrowing, or an AD–AS or PPC graph showing growth. The aggregate production function appears only in multiple-choice questions.

Common traps

Trap 1. A shrinking deficit is still a deficit: the national debt keeps rising, just more slowly. Only a budget surplus reduces the debt.

Trap 2. When fiscal and monetary policy pull a variable in opposite directions, the answer is "indeterminate". Check each variable separately: usually one change is certain and the other is not.

Trap 3. Growth is measured per person. If the population grows faster than real GDP, real GDP per capita falls even though real GDP rises.

Memory trick

MV = PY: "My Very Pricey Yacht". Money times velocity buys prices times output.

Mirror rule: SRAS left ⇒ SRPC right; SRAS right ⇒ SRPC left.

How AP® Macroeconomics questions are written

The exam has 60 multiple-choice questions (5 choices each), plus 3 free-response questions. The guide sorts the questions into 5 types; spot the type and you'll know what the question wants before you read the choices.

Type 1

Name the concept from an example

A short scenario about a worker, a firm, a market or a whole economy, then "Which of the following best describes..." with five economic terms as choices.

  • Before reading the choices, name the concept from the key detail: why the worker is jobless, what pushed prices up, which curve moved.
  • Find your term among the choices. If two look alike, use the one detail that separates them (a short job search vs. a skills mismatch; a shift vs. a movement along a curve).
  • Cross out choices that need a fact the scenario never gives, such as a recession that is never mentioned.
Type 2

What happens to X and Y after a policy or shock

A starting point (often long-run equilibrium or an output gap), one change such as a policy, a shock or a shift in spending, and two-part choices like "The price level rises, and unemployment falls." Some ask about the short run, some about the long run.

  • Find the first thing that moves (AD, SRAS, an interest rate, the demand for a currency) and which way.
  • Follow the chain one link at a time and write down each variable's direction before you look at the choices.
  • Check the time frame: in the short run, output and unemployment change; in the long run, output returns to full employment.
Type 3

Read a graph described in words

A graph is shown or described in words (the AD–AS model, a PPC, the Phillips curve, the money market, the loanable funds market or the foreign exchange market), and the question asks what a point means or what happens after a shift.

  • Sketch the graph quickly and label both axes first.
  • Place the point the question describes relative to the long-run line (LRAS or LRPC) or to equilibrium.
  • Name the situation (recessionary gap, inflationary gap, shortage, surplus) before reading the choices.
Type 4

Quick calculation

A few numbers in the stem and one formula to apply: an unemployment or inflation rate, real GDP, a multiplier, a real interest rate, a money multiplier or a current account balance. The wrong choices come from common slips.

  • Write the formula before you plug in numbers (real GDP = nominal GDP ÷ deflator × 100; multiplier = 1 ÷ MPS).
  • Use the four-function calculator for anything beyond simple arithmetic.
  • Compare your answer with the slips the choices invite: dividing by the wrong total, adding instead of subtracting, mixing up the MPC and the MPS.
Type 5

Combined changes: what is indeterminate

Two things change at once, such as two curves shifting in the same market or two policies acting together, and some choices say a change is "indeterminate".

  • Work out each change on its own and note its effect on both variables (price and quantity, or price level and output).
  • Where the two effects point the same way, that variable's change is certain; where they point opposite ways, it is indeterminate.
  • Choose indeterminate only when the question gives no sizes for the shifts.

Test-day habits that add points

  1. Answer every question. There's no penalty for a wrong answer. A blank is always worth zero, so never leave one.
  2. Predict, then look. Name the answer before reading the choices. It protects you from distractors written to sound right.
  3. Eliminate. Cross out choices you know are wrong. Every choice you rule out raises your odds on a guess.
  4. Mark and move on. If a question takes more than a minute, pick your best guess, mark it and come back if time allows.
  5. Watch absolute words. Choices with "always", "never" or "only" are often wrong, because most rules and findings have exceptions. Treat this as a tiebreaker, not a rule.
  6. Change answers for a reason. Switch an answer only when you can say why the new one is better, such as a detail you missed.
  7. The three free-response questions. Section II has 3 free-response questions in 60 minutes, including a 10-minute reading period (33.35% of your score). Question 1 is a long question worth 10 points (half of the section score); Questions 2 and 3 are short questions worth 5 points each. You handwrite your answers in a paper booklet. Drawing and labeling graphs is 30–50% of the free-response points, explaining 25–35%, making assertions 10–20% and numerical analysis 10–25%. Label every axis and curve, show the direction of each change, and show your work on every calculation.

Pacing: 60 questions in 70 minutes, about 70 seconds a question.

AP® Macroeconomics flashcards

Try the first 8 cards free. Read the term, say the definition out loud, then select the card to check yourself. Arrow keys move between cards.

Free card 1 of 8 (deck total: 187)

How to study for AP® Macroeconomics: a 5-step plan

Follow the steps, then enter your test date. The planner gives you a dated plan that starts with the heaviest areas and saves the last days for review.

  1. Take the 10 free questionsSee which AP® Macroeconomics areas you already know.
  2. Study the heaviest areas firstStart with Long-Run Consequences of Stabilization Policies, National Income and Price Determination and Financial Sector, then work down the exam map.
  3. Learn each term with an exampleSay the definition out loud, then check it with the flashcards. A term you can't use in an example isn't learned yet.
  4. Quiz yourself and study the trapsAfter each area, answer its quiz and read why the tempting wrong answer is wrong.
  5. Plan backwards from your exam dateBuild a dated plan, keep the last days for a full review, and read the cram sheet the night before.

How it works

  1. 1Check outSelect Get the guide · $5 and pay on TransferCredit.org's secure checkout.
  2. 2Download the PDFFrom your TransferCredit.org account.
  3. 3Study the heaviest areas firstFollow the 2-, 4- or 8-week plan, then read the cram sheet the night before.

This page or the full guide

Everything on this page is free with no account. The full guide is a PDF you keep.

What's on this page and in the full study guide
Study toolThis pageFull study guide ($5)
ChaptersA preview of 1 of 6All 6
Terms explainedA sample from the open chaptersAll 187, each with an example
Practice questions10 free questions43, with an answer key
Flashcards8 cardsAll 187 terms on the self-check list
Study planDated planner2-, 4- and 8-week plans
Cram sheet—2 pages, for the night before
FormatWeb page44-page PDF, printable

Questions students ask

What's in the full AP® Macroeconomics study guide?
44 pages: 6 chapters, one for each area of the College Board's official course and exam description, heaviest topics first. 187 terms, each with a plain-English definition and an example, common traps and memory tricks, 43 practice questions with an answer key that explains every answer, question tactics, 2-, 4- and 8-week study plans and a 2-page cram sheet.
How much is the full AP® Macroeconomics study guide?
The full 44-page PDF is $5. The 10 practice questions on this page are free.
How do I get the full guide?
Select Get the guide · $5 and check out on TransferCredit.org. Then sign in to your TransferCredit.org account to download the PDF.
Can I print the guide or use it on my phone?
Yes. It's a PDF, so it opens on phones, tablets and computers, and printing is allowed. Its tick boxes and answer bubbles work in PDF readers that support forms. Copying and editing are turned off.
Can I try the AP® Macroeconomics guide before I buy it?
Yes. This page has 10 questions from the guide's own chapter quizzes, a preview of the heaviest area, 8 flashcards and a study planner. No account needed.
Is this an official AP® study guide?
No. AP® is a trademark registered by the College Board, which is not affiliated with, and does not endorse, this guide. TransferCredit.org is independent. We built the guide from the College Board's official course and exam description, and the exam details were checked against the College Board's published exam information in 2026.
How was this study guide made?
One chapter for each area of the official course and exam description, using its published weights. Each chapter was written, then fact-checked against the official exam information in a separate review. The practice questions are original: none are copied from the College Board's released questions.
How up to date is this AP® Macroeconomics guide?
Last updated 2026. The exam details were checked against the College Board's published exam information in 2026. Exams change, so confirm the details on the official AP® Macroeconomics page before you test.
More questions about the AP® Macroeconomics exam (16)
What is the AP® Macroeconomics exam?
The AP® Macroeconomics exam is from the College Board. It has 60 multiple-choice questions (5 choices each), plus 3 free-response questions. You get 70 minutes for multiple choice (2 hours 10 minutes in all), four-function calculator allowed. The score scale is 1–5 (AP® score scale; many U.S. colleges give credit for 3 and above). The guide has 6 chapters, one for each area of the official course and exam description; the heaviest is Long-Run Consequences of Stabilization Policies at 20–30%.
How many questions are on the AP® Macroeconomics exam, and how long is it?
Section I has 60 multiple-choice questions in 70 minutes (66.65% of your score), each with five choices. Section II has 3 free-response questions in 60 minutes, including a 10-minute reading period (33.35%): one long question (10 points) and two short questions (5 points each).
How is the AP® Macroeconomics exam scored?
The score scale is 1–5: AP® score scale; many U.S. colleges give credit for 3 and above. Your multiple-choice score is the number of questions you answer correctly, so a wrong answer costs nothing.
What AP® Macroeconomics score do I need for college credit?
Many U.S. colleges give credit for 3 and above. Each college sets its own credit policy, so check the one at your college before you count on the credit.
How much does the AP® Macroeconomics exam cost?
The fee is $99: per exam in the U.S. and Canada in 2026-27; your school may charge more. Fees can change, so check the official page when you register.
Can I use a calculator on the AP® Macroeconomics exam?
A four-function calculator is allowed on both sections (your own or the Desmos 4-function calculator in Bluebook); scientific and graphing calculators are not.
Is there a penalty for guessing on AP® Macroeconomics?
No. There's no penalty for a wrong answer. A blank is always worth zero, so never leave one.
What topics are on the AP® Macroeconomics exam?
6 areas, from the official course and exam description: Long-Run Consequences of Stabilization Policies (20–30%); National Income and Price Determination (17–27%); Financial Sector (18–23%); Economic Indicators and the Business Cycle (12–17%); Open Economy—International Trade and Finance (10–13%); Basic Economic Concepts (5–10%).
Which AP® Macroeconomics topics should I study first?
The 3 heaviest areas (marked in the map) carry about 41 of the 60 questions. The guide puts them first, so working front to back covers the most points earliest.
Is the AP® Macroeconomics exam hard?
It depends on what you already know. The largest area, Long-Run Consequences of Stabilization Policies, is 20–30%, and the smallest, Basic Economic Concepts, is 5–10%. Try the 10 free questions above to see where you stand in about 10 minutes.
What kinds of questions are on the AP® Macroeconomics exam?
The exam has 60 multiple-choice questions (5 choices each), plus 3 free-response questions. The guide sorts the questions into 5 types: “Name the concept from an example”, “What happens to X and Y after a policy or shock”, “Read a graph described in words”, “Quick calculation” and “Combined changes: what is indeterminate”. Multiple-choice questions have 5 answer choices. See how each type is written.
What are the free-response questions on the AP® Macroeconomics exam?
Section II has 3 free-response questions in 60 minutes, including a 10-minute reading period (33.35% of your score). Question 1 is a long question worth 10 points (half of the section score); Questions 2 and 3 are short questions worth 5 points each. You handwrite your answers in a paper booklet. Drawing and labeling graphs is 30–50% of the free-response points, explaining 25–35%, making assertions 10–20% and numerical analysis 10–25%. Label every axis and curve, show the direction of each change, and show your work on every calculation.
How should I pace myself on the AP® Macroeconomics exam?
60 questions in 70 minutes, about 70 seconds a question. If a question takes more than a minute, pick your best guess, mark it and come back if time allows.
How long should I study for AP® Macroeconomics?
Take the 10 free questions to see where you stand. The full guide has 2-, 4- and 8-week plans built from the exam weights, and the planner on this page builds a dated plan from your exam date.
How do I know I'm ready for the AP® Macroeconomics exam?
The guide's readiness checklist: You can explain every term on the checklist without notes. You score 80% or better on every chapter quiz. You can read the cram sheet and nothing on it surprises you. You know the AP® score your college gives credit for, and your exam date.
What should I do the night before?
Read the 2-page cram sheet once, slowly. Check your exam time and room with your AP® coordinator. Multiple choice is in the Bluebook app; free-response answers are handwritten in a paper booklet. Bring an approved four-function calculator or use the one in Bluebook. In the morning, skim the traps, then stop studying.

How we built this guide

We built one chapter for each area of the College Board's official course and exam description for AP® Macroeconomics, using its published weights to order the chapters and size the quizzes. Each chapter was written, then fact-checked against the official exam information in a separate review. The exam details were checked against the College Board's published exam information in 2026.

Sources: official AP® Macroeconomics page, official course and exam description. Last updated 2026.

AP® is a trademark registered by the College Board, which is not affiliated with, and does not endorse, this guide. TransferCredit.org is independent and not affiliated with the College Board. © 2026 UPI Globale Edu Inc.

Ready for the full AP® Macroeconomics guide? 44 pages, 187 terms, 43 practice questions and a 2-page cram sheet, $5.

Get the guide · $5

In the full guide

TransferCredit.org Guide to AP® Macroeconomics

  • All 6 chapters
  • 187 terms with examples
  • 43 practice questions with an answer key
  • A 2-page cram sheet and 2-, 4- and 8-week plans
Get the guide · $5